


Intro to Interactive Excel Dashboards and Why You Should be Using Them
If you’re still relying on static reports and tab-heavy spreadsheets to make decisions, it’s time to level up. Enter: the interactive Excel dashboard—a powerful way to explore your business data, uncover insights, and make decisions faster.
In helping more than 800 businesses, I’ve seen one too many client with dozens of spreadsheets and countless tabs being used to (attempt to) display the data they need to see.
That’s why in this post, I’m going to explain what interactive Excel dashboards are, how they work, and how they can do the work of dozens of tabs or even spreadsheets. Ready to consolidate and build a tool you’ll love using? Let’s go!
What Is an Interactive Excel Dashboard?
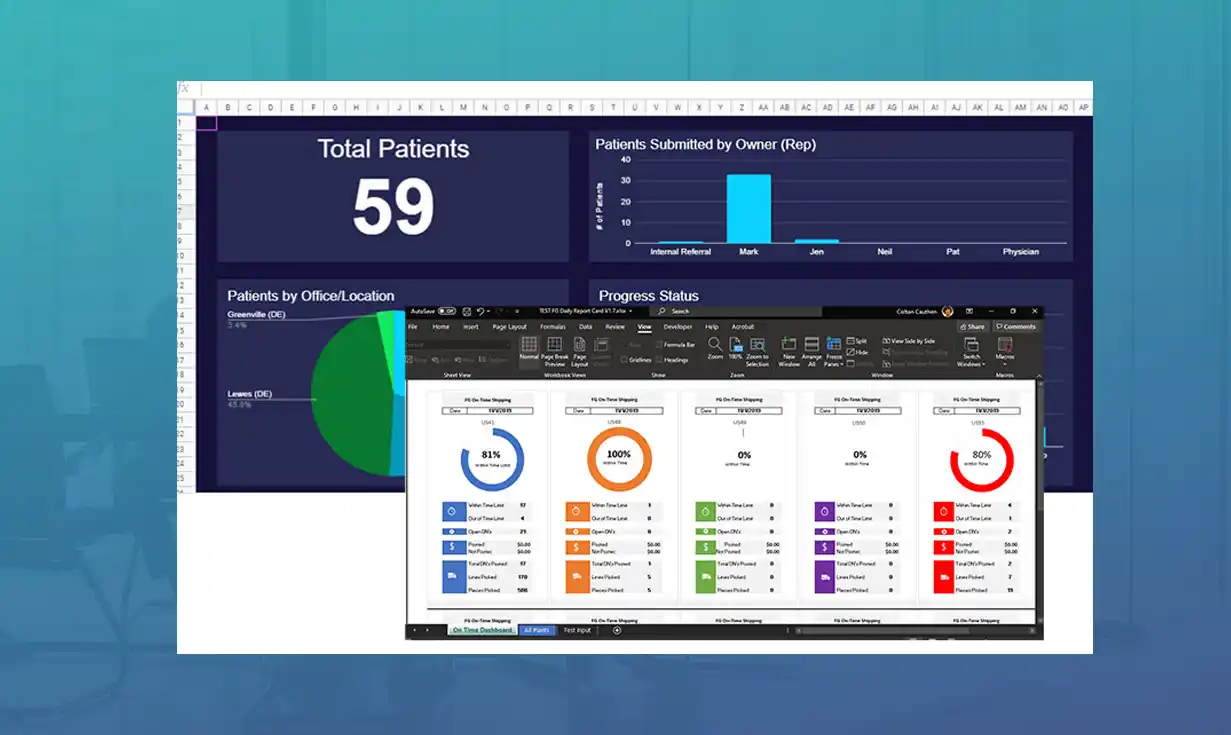
An interactive Excel dashboard is a dynamic, visual report built inside Microsoft Excel that allows users to filter, explore, and analyze data in real time—without touching raw data or writing formulas.
Instead of scrolling through endless tables or switching between tabs, users can:
- Click a drop-down to select a date range
- Use slicers to view data by region, product, team or time period
- Hover over charts for detailed insights
- Update all charts with the click of a button
In short, interactive dashboards transform Excel from a data-containing dumpster fire into a decision-making paradise.
Key Features of an Interactive Excel Dashboard
Here’s what sets interactive dashboards apart from traditional Excel reports:
✅ Filters and Slicers
Let users drill down into the data with just a click—no formulas or coding required.
✅ Automatically Updating Charts
Connect your dashboard to dynamic data ranges or external sources so charts stay current with minimal effort.
✅ Drop-Down Menus and Toggle Options
Allow users to switch views, categories, or time periods to see the exact data they need.
✅ Clean, Visual Layouts
Highlight KPIs and trends using charts, gauges, and conditional formatting—not just rows of numbers.
Why You Should Be Using Interactive Excel Dashboards
Interactive dashboards aren’t just flashy—they’re functional. Here’s why your business should be using them:
1. They Save Time (Every Single Week)
No more copying and pasting numbers into reports. Dashboards pull from your existing data, so your reports are always up to date. This means less time building reports and more time analyzing and acting on the results.
2. They Empower Your Team
When reports are easy to use and understand, people use them. Interactive dashboards help non-technical users explore the data themselves, leading to faster decisions and fewer bottlenecks.
Example: A sales manager can filter by rep or region without asking someone in IT for a custom report.
3. They Reduce Errors
Static reports are prone to human error—manual updates, broken formulas, outdated data. Interactive dashboards, built correctly, minimize those risks by updating automatically and using controlled inputs.
4. They Make Your Data Easy to Understand
Color-coded indicators, clean visuals, and focused layout mean that users can spot trends and issues immediately. No more digging through pivot tables or asking what a number means.
5. They’re More Affordable Than Business Intelligence Tools
Power BI, Tableau, and other BI platforms are great—but they require time, training, and big budgets. An interactive Excel dashboard gives you 80% of the benefit at a fraction of the cost, using a tool you already know and own.
When Should You Build One?
Today, obviously. But here are some examples of what interactive dashboards are perfect for tracking:
- Sales performance
- Marketing results
- Financial KPIs
- Customer service metrics
- Operations and inventory trends
How Hard is it to Build an Interactive Dashboard?
This all sounds great, but you may be wondering how difficult it’s going to be to get set up with your own custom interactive dashboard.
The truth is, that’s going to depend (unsurprisingly) on your familiarity with Excel. If you are an Excel wizard, you should be able to crank one out in a few hours, depending on the complexity of your needs. Otherwise, you should plan to set aside a decent amount of time to learn the basics and then work on putting them to practice.
Here’s some good news. Whether you’re struggling to get started or need help polishing off what you’ve been working on, we can help. At Custom Excel Spreadsheets, we specialize in building custom interactive dashboards for small and medium-sized businesses using Excel and Google Sheets. To learn more, just click the button below for a free consultation with someone from our team
