Dashboards & Visualization
Our team of experts can transform your raw
data into clear, actionable insights with our team of Excel experts and developers.
Custom Excel Spreadsheets
Turn Your Business Data into Insightful, Interactive Dashboards


At Custom Excel Spreadsheets, we specialize in building custom dashboards and data visualization tools that make your numbers make sense. Whether youre tracking KPIs, managing budgets, or pulling reports from multiple data sources, we turn raw data into clear, interactive visuals that help you see the big picture—and the important details. Our Excel and Google Sheets dashboard solutions are fully tailored to your business needs and workflow.
Using advanced Excel and Google Sheets features and drawing on years of design and development experience, we create smart, user-friendly dashboards that you can update with the click of a button. No expensive software. No learning curves. Just actionable insight, custom built, and ready for you to hit the ground running.
Why Custom Dashboard Solutions by CES?
Why have more than 800 businesses chosen to work with our team to build custom solutions? Because we don’t just build charts, we deliver clarity. Businesses need simple, clear answers to complex questions. They need to spot trends, make accurate projections, track progress and make decisions with confidence without spending hours a week pouring over and manipulating datasets manually.
That’s exactly what we deliver.
At CES, we don’t just build dashboards — we build decision tools. Every dashboard is tailored to your unique business goals, workflow, and intended audience. Reports for upper-level management or prospective investors can’t look the same as production dashboards for technicians. Each one needs to speak their respective language and tell them what they want to know with ease in a medium that is visually compelling.
That’s why we start by leveraging our business consulting capabilities to get clarity about your specific application. Next, we’ll design a fully customized solution that gets you what you need quickly and efficiently.
In sum, here’s why businesses choose us:
We speak your language. We bridge the gap between data and decision-making, turning complex info into visuals that are easy to understand and act on.
No fluff, just function. Your dashboard won’t just look good — it’ll work exactly the way you need it to, solving real problems in real time without the distracting clutter of things you don’t need.
Customized for how you work. Every dashboard is built from scratch to reflect the way your business actually runs — not based on generic templates.
Fast & Easy Deployment. Because we primarily work with Microsoft Excel and Google Sheets to build our custom data visualization tools, there is no complicated deployment process. Our team can get you up and running with your custom dashboards and reporting tools in a matter of days.
You own it. No subscriptions. No black boxes. You get a powerful, fully editable tool that you can use and update freely for years to come.
What’s Included in Your Custom Excel Dashboard?
Since our deliverable will be fully-customized around your needs, the short answer is ‘whatever you want it to include.’ With that being said, here are some common features of our services and the tools we develop:
Automated Data Pulls. No more manually copying and pasting data from dozens of sources every week. Depending on the application, our team can set up automatic data refreshing through API’s, Excel’s PowerQuery and other data integration tools. We can also write custom scripts for importing data from CSV files. We can also extract data from PDFs, emails, OneDrive and other sources through our partnership with Lido.
Interactive Slicers & Filters. Want to switch from the current year to the previous year? Want to see data company-wide, then drill down into specific product lines or regions? Want to see overall team performance then compare individuals against the team
benchmarks? All of this an much more can be done with a single click using our custom interactive dashboards.
Automatic Report Generation. Need to share results to collaborate with team members or other divisions? Want to send a summary report to a manager or direct report? No problem. We can configure the tool to capture the information you want to share and put it in PDF-format or a separate spreadsheet so that the end-user only sees what you want them to. We can also automatically generate emails with reports already attached.
Deployment & Training. Once the tool is finished, it’s all yours. But sometimes it’s nice to have help getting a new tool deployed to ensure everyone knows how to use it. While our solutions are highly intuitive, we can provide live or pre-recorded training as needed to make sure your deployment goes smoothly and to make it easy to bring future users
or new hires up-to-speed.
Customized Solutions
Frequently Asked Questions
If you’re regularly pulling reports, tracking metrics across multiple files, or manually crunching numbers to answer recurring business questions — then yes, a custom dashboard will save you time and improve clarity so you can make solid decisions. If you feel like you’re making blind guesses with no sense of critical trends pertaining to your business or feel like you are not in control because you don’t have a handle on the numbers—then yes. Our dashboards are designed to streamline capturing and making sense of the data that matters to you.
We’ve built dashboards for sales performance, financial summaries, inventory management, project tracking, employee productivity, customer service metrics, marketing performance, and more. If you have data — we can turn it into something visual, automated, and useful.
Yes, in most cases. We can link your dashboard to data sources like raw Excel sheets, CSV files, or connected workbooks so that your visuals and summaries update as soon as the data changes. We also offer automation options using Power Query, APIs or VBA where needed.
Absolutely. We design dashboards that are easy to use and share. Whether you want a single master dashboard or multiple user-specific versions, we’ll set it up so your team can access and interact with it confidently.
Most dashboard projects take between 1 to 3 weeks, depending on complexity and responsiveness during the process. If you’re on a tight timeline, let us know upfront and we’ll confirm the turnaround time before we get started.
Absolutely! Our team is well-versed in both Excel and Google Sheets and can help you make
the right decision regarding which is best for your use case.
Everything we do is tailored to our clients’ unique needs. Since all of our projects are custom, costs will vary. That’s why we offer free consultations upfront to map out the project scope and cost. This allows our clients to know what price to expect before agreeing to any work. Generally speaking, projects tend to fall within the range of $1k to $5k. Our goal is always to provide the best solution possible within our client’s available budget.
You will have full ownership of the tool and can edit it any way you would like. If the revision or upgrade you would like is beyond your skillset or you find you don’t have time to get to it, no problem. Just reach out to our team and we’ll get it taken care of for you.
Customized Spreadsheet Solutions
How To Get Started
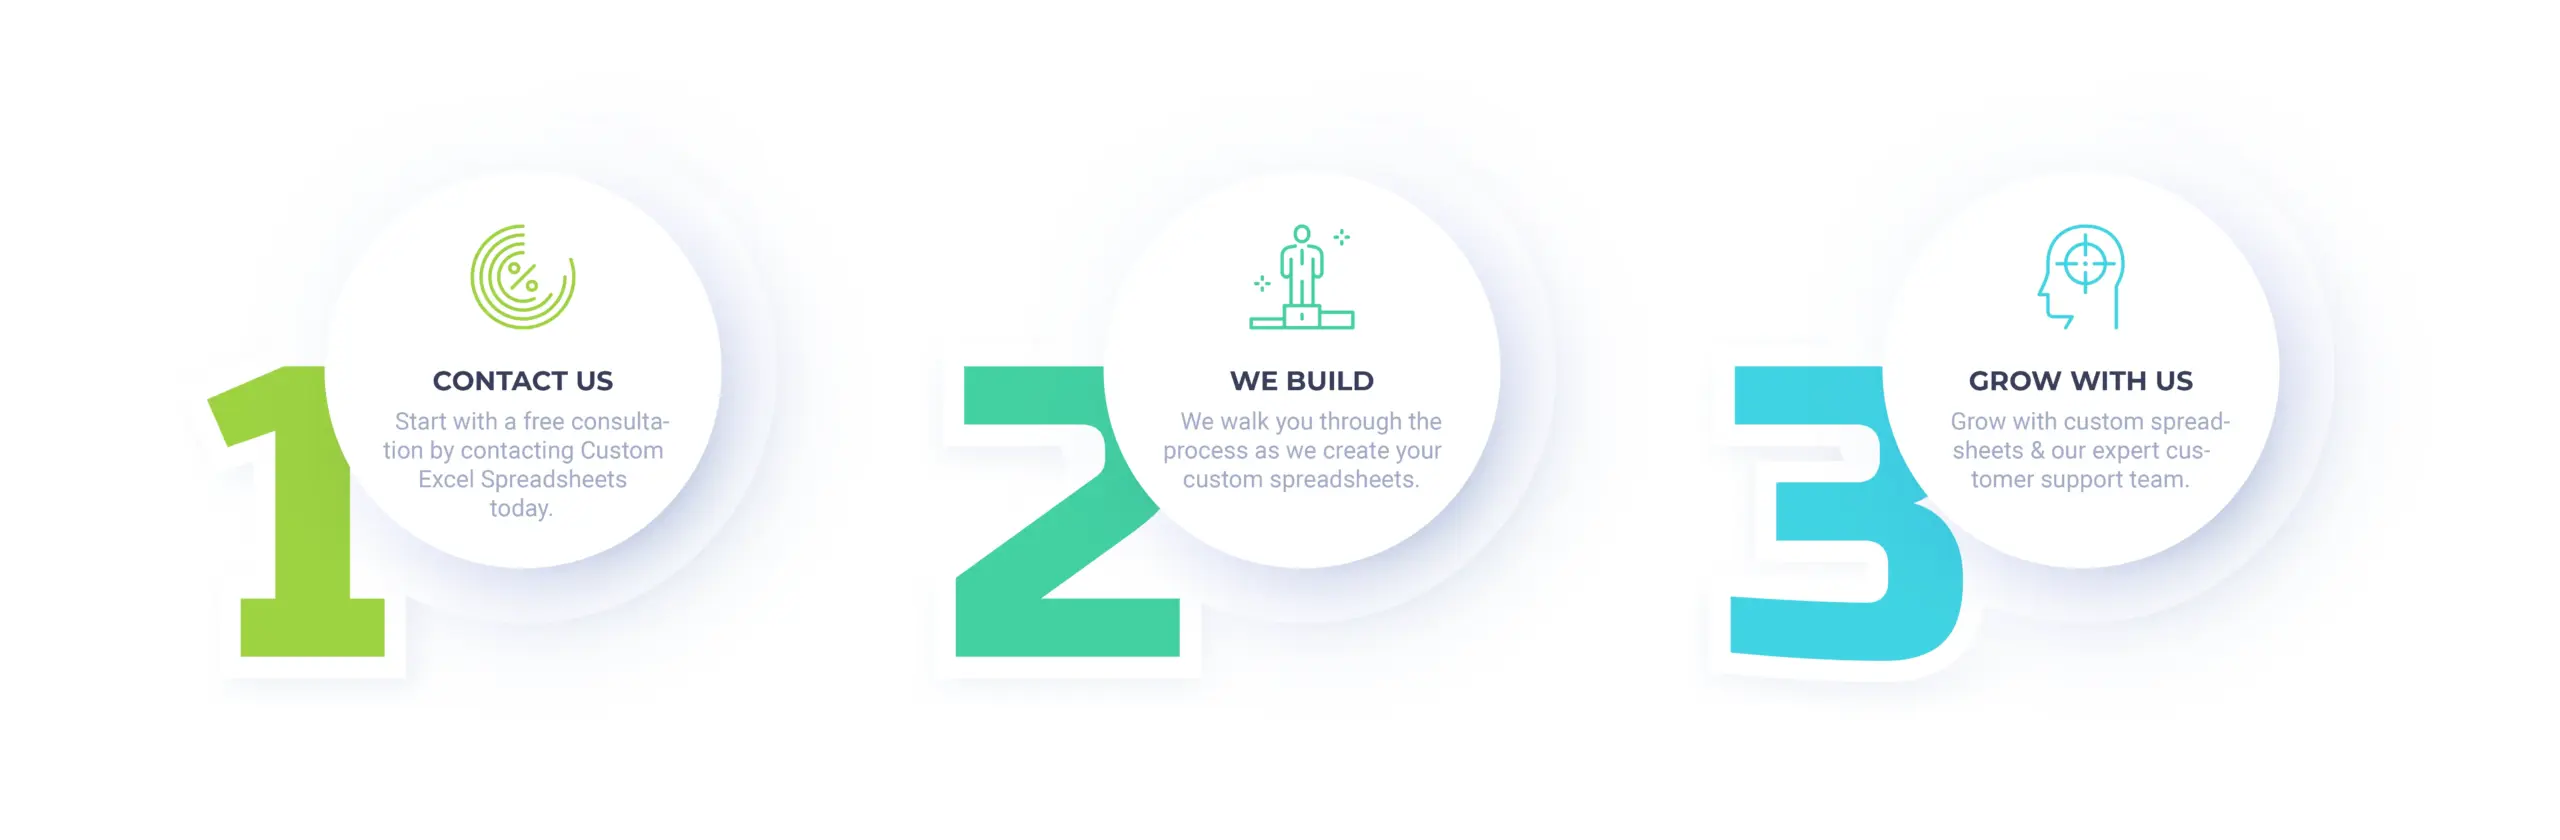
We believe in personalized service. As a result, we recommend that you to book a consultation call with our team to discuss your specific needs. Upon understanding your needs, we will showcase our expertise and provide a feasible roadmap of how we will develop your custom spreadsheet solution.
No financial commitment is required to have a consultation which means you can pay $0 and get immediate access to a top-notch team of Excel experts to discuss your needs and brainstorm ideas. Getting started is as easy as clicking the button below and selecting a day and time that is convenient for you. Our team is able to meet virtually using Zoom or Microsoft Teams so there is no travel or in-person meeting required.
Free Excel Dashboard Consultation
To get started, click the button below. We look forward to hearing from you and seeing how we can help make your life easier and your business better.